In-silico follow-up results for freeze V4
October 22, 2020
DISCLAIMER: In-silico analyses posted in this page are uploaded by partners of the COVID-19 HGI, but not peer reviewed or subjected to extensive quality control by the community. Please keep that in mind when using these results.
-------------------------------------------------------------------------
Please find the results from V3 (June 2020) here
Fine-mapping
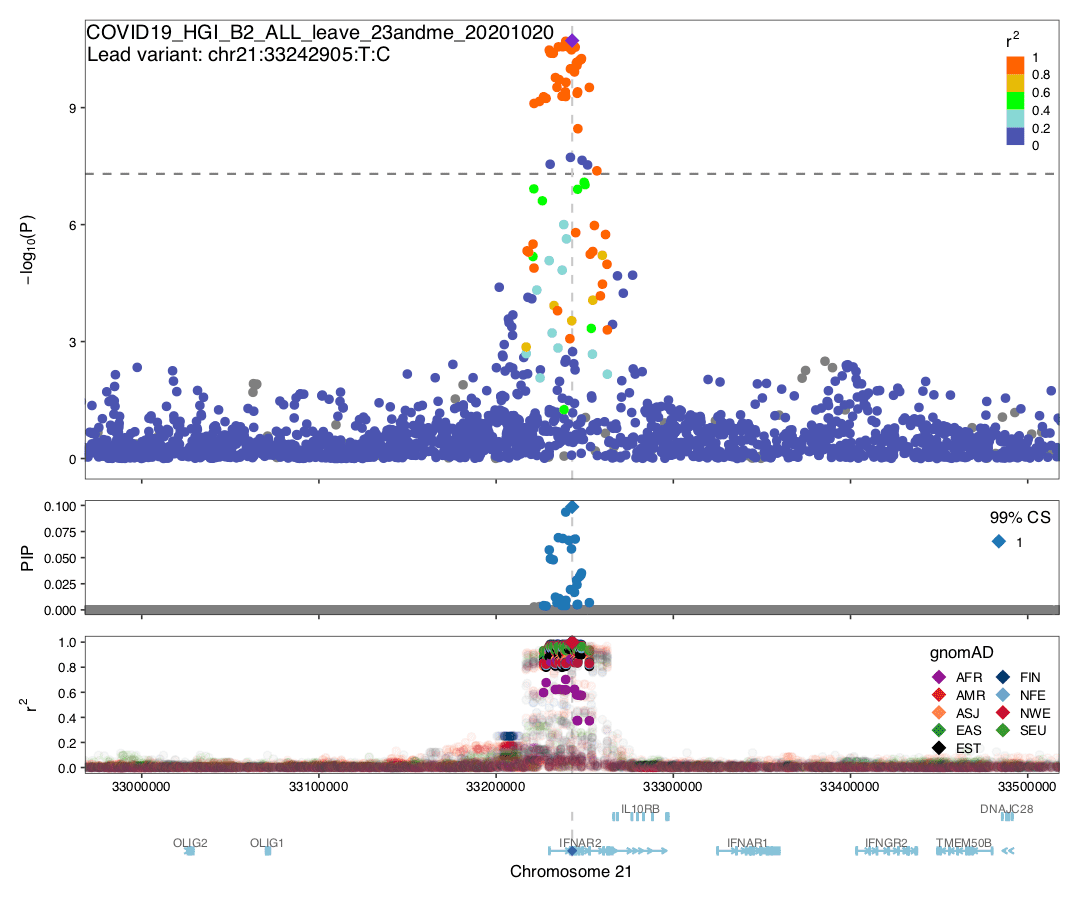
Summary: We conducted statistical fine-mapping of the meta-analysis results (full genome-wide results from the leave_23andme file), assuming a single causal variant per locus and a shared causal effect across studies (without accounting for heterogeneity between studies). For each locus with P < 5e-8 (3 Mb window around the lead variant), we applied approximate Bayes factor (ABF) with a prior variance W = 0.04 (Wakefield, J. 2009) to estimate posterior inclusion probability (PIP) and 95/99% credible sets. Although ABF estimates several variants with high PIP, we note that the results should be interpreted cautiously given potential biases from different phenotyping/genotyping/imputation across studies. In particular, missing variants and heterogeneity among the cohorts could undermine meta-analysis fine-mapping significantly, as illustrated by the discrepancy between a manhattan plot vs. observed LD structure in gnomAD.
Authors: Masahiro Kanai, Hilary Finucane
Data: HERE
README: HERE
-------------------------------------------------------------------------
Prioritization of putative target genes underpinning COVID-19 host GWAS traits based on high-resolution 3D chromosomal topology
Summary. GWAS variants commonly map to DNA regulatory regions, many of which are located away from their target genes, coming into their proximity through 3D chromosomal interactions. We previously generated high-resolution Capture Hi-C data on the chromosomal contacts involving all annotated gene promoters in 17 human primary blood cell types (including endothelial precursors) and developed COGS, a statistical pipeline for GWAS gene prioritisation based on these data (Javierre et al., 2016). Applying COGS to COVID-19 host GWAS data using the same panel of cell types, we prioritise multiple putative associated genes such as those known to be involved in immune function (including ETS1, IFNAR1/2, OAS3, CCR1 and others) and lung biology (such as DPP9 and FOXP4). Full results are listed in Table S1, with Manhattan plots shown in Figures S1-S7 and examples of prioritised loci shown in Figures S8-S11. These data, used in conjunction with other prioritisation approaches, will aid in the understanding of COVID-19 pathology, paving the way for novel treatments.
Authors: Michiel J Thiecke, Emma Yang, Helen Ray-Jones, Oliver S Burren & Mikhail Spivakov
Data: TableS1COVID19GWASJavierre2016PCHiCCOGSv2GWAS_v4.txt
Supplementary Figures & Table S2: COGSSupplementaryFiguresandTableS2v2GWASv4.pdf
README: README_COVID19hg COGSv2GWAS_v4.pdf
-------------------------------------------------------------------------
Detecting independent genetic signals - GCTA COJO
In order to identify all independent variants, I used the GCTA software to perform joint association analysis in the meta-analysis results per model outcome. This approach fits an approximate multiple regression model using summary-level meta-analysis statistics and LD corrections estimated from a reference panel (here the ~400K White British from UK Biobank). I adopted a chromosome-wide stepwise selection procedure to select variants and estimate their joint effects at a p-value cut-off of 1e-05. The analysis was restricted only to variants with MAF>=0.1%. Furthermore, variants with large frequency discrepancies (>0.2) from the reference panel (UK Biobank) were omitted from the model.
All analysis were based on the meta-analysis Round 4 results without 23andMe.
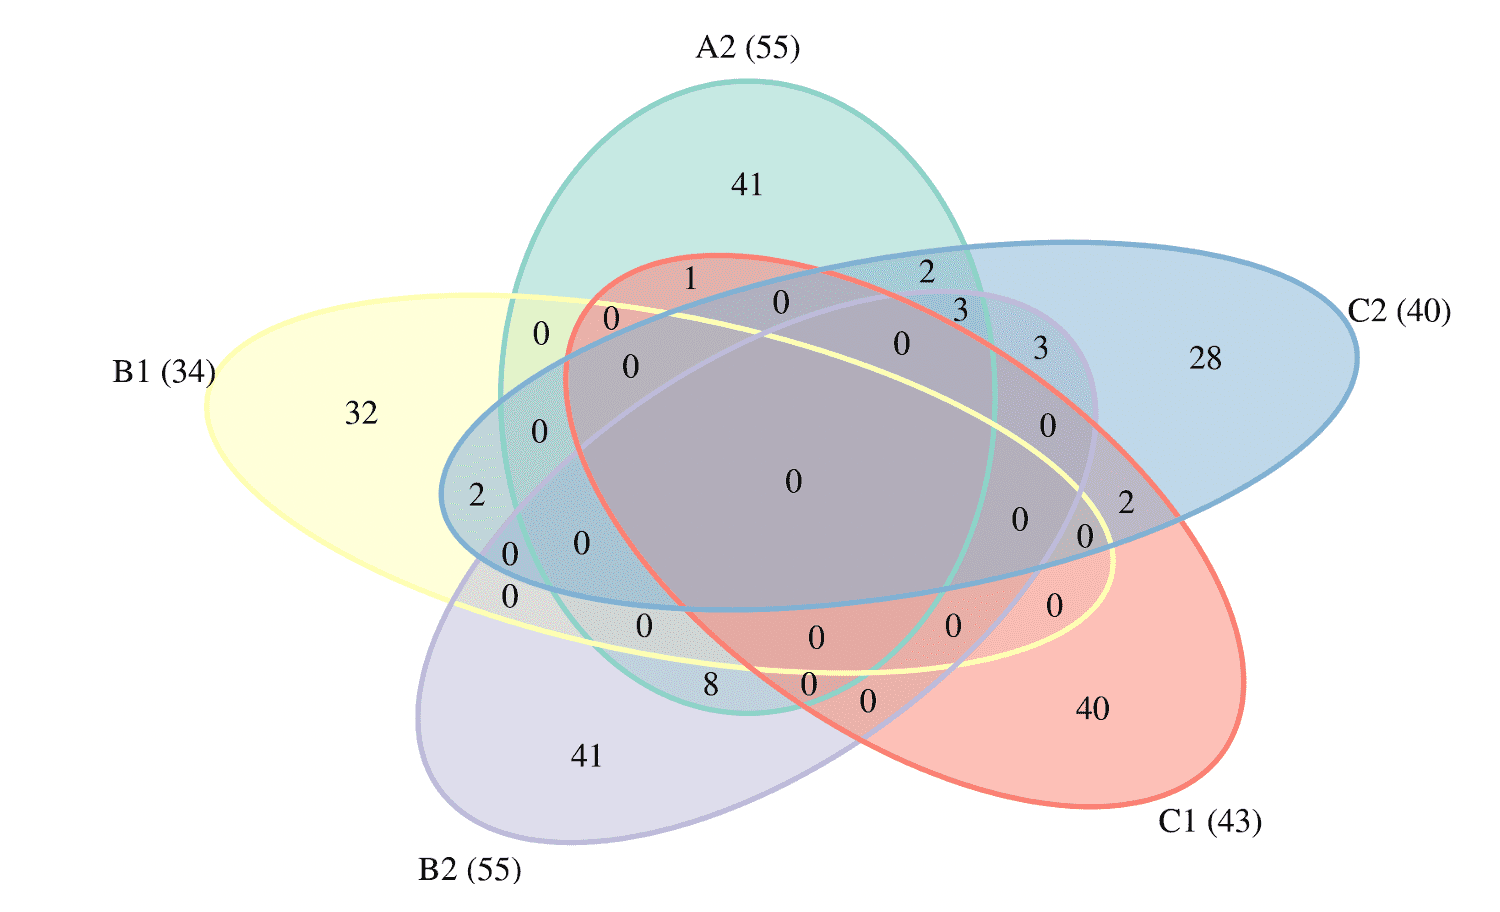
The number of independent variants at a joint p <1e-05 for each model were: 25 for A1ALL, 84 for A2ALLleave23andme, 49 for B1ALL, 83 for B2ALLleave23andme, 70 for C1ALLleave23andme, 62 for C2ALLleave23andme and 59 for D1_ALL.
I used the independent variants to prioritise genes within a 500Kb window (either side) with the PoPS method. This method is a gene prioritization method that leverages genome-wide signal from GWAS summary statistics and incorporates data from an extensive set of public bulk and single-cell expression datasets, curated biological pathways, and predicted protein-protein interactions (https://www.medrxiv.org/content/10.1101/2020.09.08.20190561v1). The PoPS analysis assigns a Polygenic Priority Score to each of 18,383 protein coding genes, based on the GWAS summary statistics. The gene with the highest PoPS score within 500Kb window from the independent variant is assigned as the prioritised gene for the locus. Prioritised genes for the GWS hits include VSTM2A, TYK2, IFNAR2, DPP9 and CCHCR1 both for A2 and B2, LZTFL1 for A2, B2 and C2, OAS3, LAMB1 and DSCAM for A2, FYCO1 for B1, BARHL2, OAS1 and SURF6 for B2, SLC6A20 for C1 and OBP2B and TCF19 for C2.
Author: Stavroula Kanoni, PhD
Data: COVID19HGI20201020.IndependentVariants.GenePrioritisation.zip


